Major Stare
|
| posted on 12/6/11 at 06:36 PM |

|
|
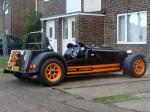
R1, 5PW, 2003 Map.....
Following on from a previous post, i'd like your thoughts on this map.
Yamaha R1, 5PW, 2003. Stock Airbox.
[Edited on 12/6/11 by Major Stare]
Jon "FISH"
|
|
|
|
|
adithorp
|
| posted on 12/6/11 at 07:00 PM |
|
|
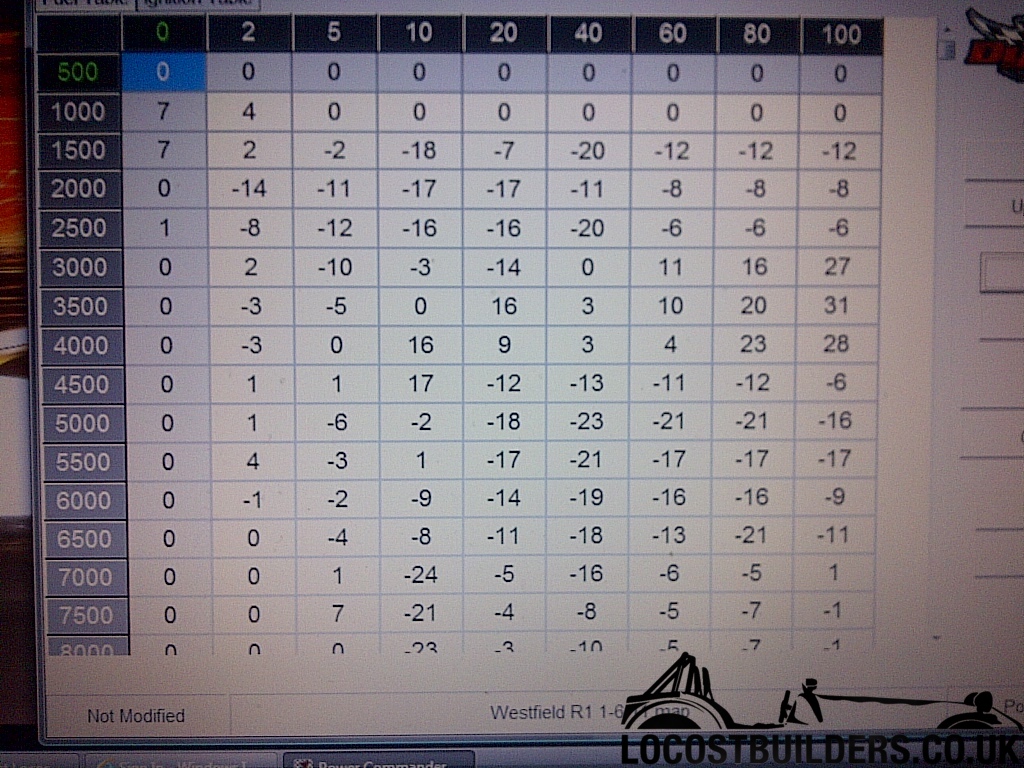
Can't say about the rough running but if it's rich at idle I'd get rid of the extrta fueling at idle. So change the two 7's at
0 throttle 1000/1500rpm for 0s or even -5ish and see how it is then.
My 5vy has -7 there.
"A witty saying proves nothing" Voltaire
http://jpsc.org.uk/forum/
|
|
|
mark chandler
|
| posted on 12/6/11 at 09:33 PM |
|
|
I know nothing about power commander maps but....
Maps usually follow a pattern with smooth progressions, this leaps all over the place with no apparant logic !
What are the X figures, values MAP values?
As an example at 40 going downwards 0 -20 -11 -20 0 looks awful, as if it was mapped while acceration enrichment was taking place.
Going across at 1500rpm -18 -7 -20
I would put this into a 3d graph in excel and smooth things out, weeding out the values with large leaps.
Regards Mark
[Edited on 12/6/11 by mark chandler]
|
|
|
Major Stare
|
| posted on 12/6/11 at 10:15 PM |
|
|
Calling Andy Bates to the forum !!! ????
Jon "FISH"
|
|
|
afj
|
| posted on 14/6/11 at 06:28 PM |
|
|
Those numbers dont look wrong. Just mke sure you have tht map saved and go on the power commander web site on the download bit and select your model
engine and you can download a few 20+ maps all based on different exhausts and filters your map looks like the others on there with a full system and
filter. You can try them all out just upload the new map and drive if you want to send me your map ill upload it and try it. U2u me

eerrrrrrrrrrrrrrrr
|
|
|
adithorp
|
| posted on 14/6/11 at 06:48 PM |
|
|
quote:
Originally posted by mark chandler
I know nothing about power commander maps but....
Maps usually follow a pattern with smooth progressions, this leaps all over the place with no apparant logic !
What are the X figures, values MAP values?
As an example at 40 going downwards 0 -20 -11 -20 0 looks awful, as if it was mapped while acceration enrichment was taking place.
Going across at 1500rpm -18 -7 -20
I would put this into a 3d graph in excel and smooth things out, weeding out the values with large leaps.
Regards Mark
[Edited on 12/6/11 by mark chandler]
The Power Commander is a piggy back device on the fueling side of the original ECU. It adds or subtracts a percentage to the original fueling at any
given throttle % (the X figures) and revs. As a result the figures depend on what the standard fueling results in. This often causes the spread in
that map. You can't read it like a normal map with steady changes.
"A witty saying proves nothing" Voltaire
http://jpsc.org.uk/forum/
|
|
|