MK has been mapped todaykarlak - 11/7/13 at 05:24 PM
Have had the MK Indy with Duratec mapped today.
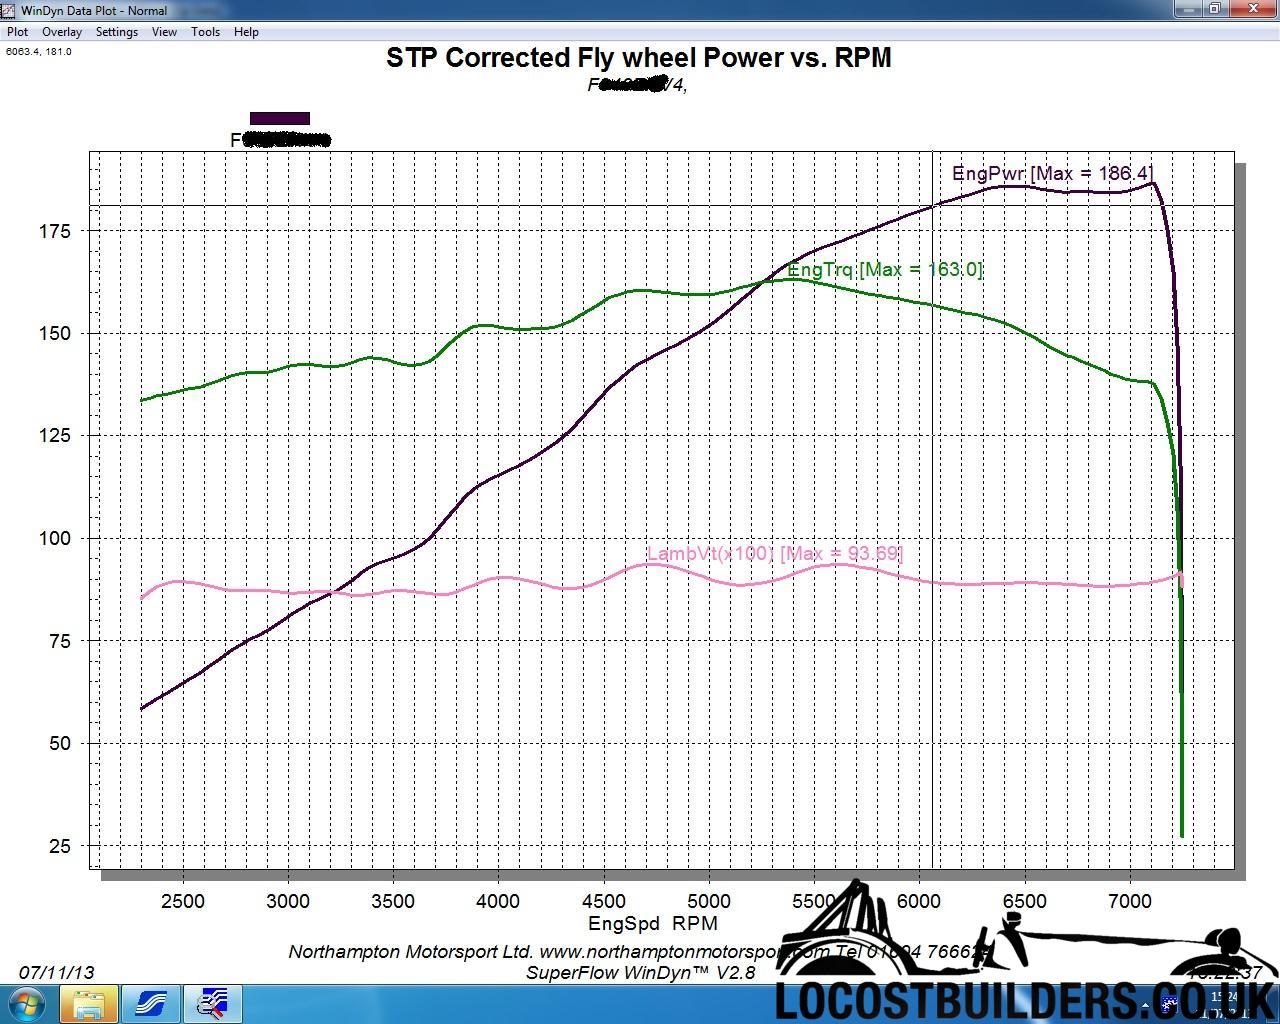
Standard Duratec, apart from ARP bottom end bolts, with Jenvey ITB's.
The car needs some tidying up then an MOT and tax hopefully in a week or so. Also, have a very slight Oil "weep" from around the the filter
area to investigate.
Anyway. very pleased with the results . It is thought that the exhaust is causing the slight drop off around 6.5k rpm. But, I think it will be
enough for me after having a pretty standard Pinto up front last time I drove it Besides, I have run out of money for new exhausts Oh and
the front end suspension needs sorting after the weight reduction
I also have a video which I can load up later if anyone is interested.
[Edited on 11/7/13 by karlak]
[Edited on 11/7/13 by karlak]
[Edited on 11/7/13 by karlak]
big-vee-twin - 11/7/13 at 05:34 PM
Yup, would like to see the video.
Wouldn't mind having a look over your map to compare it to mine if your ok with that, mines drivable but now wear near where it needs to be
wylliezx9r - 11/7/13 at 06:57 PM
Where was the car rolling roaded ? Seems like a lot of power for a pretty standard engine
karlak - 11/7/13 at 07:09 PM
The name of the tuning company is on the printout -
I think those figures are pretty much regarded as "normal" for a Duratec with Throttle bodies and a free flowing exhaust.
omega0684 - 11/7/13 at 08:54 PM
thats the power at the flywheel, so chop off 20% (ish) and that is what you'll have at the wheels
SteveRST - 12/7/13 at 12:40 PM
Looks good.
I see that the rev limit seems to be set at 7100 rpm. Is that what they recommended with the ARP con rod bolts? It's not making anymore power
after 6500 anyway so that seems reasonable.
I was trying to work out how to interpret the LambVt(x100) [Max = 93.69] line on your graph. I know it's the air:fuel ratio but it was not
very obvious how to interpret it. Anyway, for your info this is how to read it....
The Lambda value on your graph has been multiplied by 100 so that it fits in with the y-axis values for power/torque. So really, that lambda value is
0.9369 (not 93.69).
Lambda is the ratio of the actual Air:Fuel Ratio (AFR) to Stoich. The stoich value for petrol is 14.7:1, which is the ratio where exactly the right
amount of air is available to burn an amount of fuel.
So, a lambda value of 1 = Stoich = AFR of 14.7:1
a lambda value GREATER than 1 is LEANER than Stoich (e.g. AFR of 15.5)
a lambda value LESS than 1 is RICHER than Stoich (e.g. AFR of 13.5)
To convert Lambda to AFR ratio you multiply the Lambda value by 14.7, so in your case the LEANEST that you engine ran was 0.9369 x 14.7 = 13.8:1 -
I guess they give you the leanest figure (maximum) as running lean under load is more dangerous than running rich.
Looking at the graph, the Air:Fuel ratio is reasonably stable and it looks like the Richest point is around an AFR of 12:8 lower down the rev range.
You'd expect fueling to go from leaner to richer under load, but it looks OK to my untrained eye with an AFR of around 13:3 at the top end.
My turbo'd Zetec runs a much richer AFR at the top-end under boost, around 11.8:1 but the richer mixture aids cooling and is much safer as
I've mapped it myself and would rather be cautious. It would make more power with a leaner mixture of around 13:5:1, but it'd probably
melt/go bang - so it's a trade off.
slow day at work....
Steve
karlak - 12/7/13 at 03:43 PM
Some videos, bit basic and non edited for those interested
pjay - 13/7/13 at 07:16 AM
Excellent result! Thanks for uploading the vids as well.
 . It is thought that the exhaust is causing the slight drop off around 6.5k rpm. But, I think it will be
enough for me after having a pretty standard Pinto up front last time I drove it
. It is thought that the exhaust is causing the slight drop off around 6.5k rpm. But, I think it will be
enough for me after having a pretty standard Pinto up front last time I drove it  Besides, I have run out of money for new exhausts